
Market Updates

Market Update: October 2024

I always tell clients that real estate moves slowly. We are seeing similar numbers in statistics as we have in past months, but anecdotally, we have been able to get some great deals for buyers on properties recently, suggesting that pricing could be softening, but we haven’t seen the trends appear yet in the statistics.

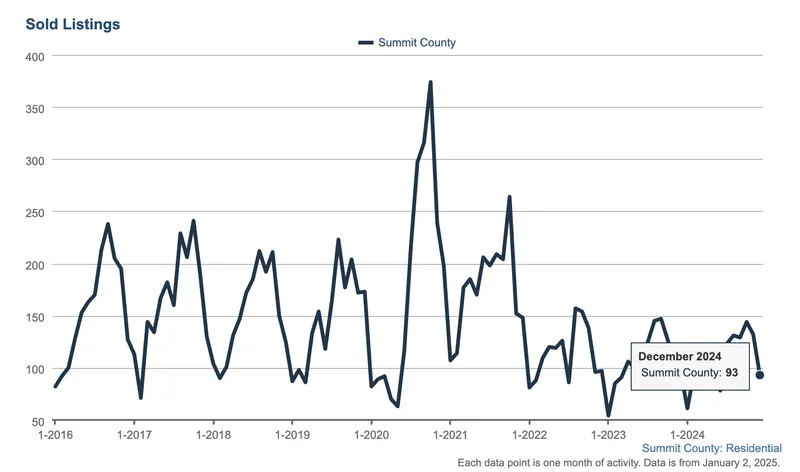
Number of Sales

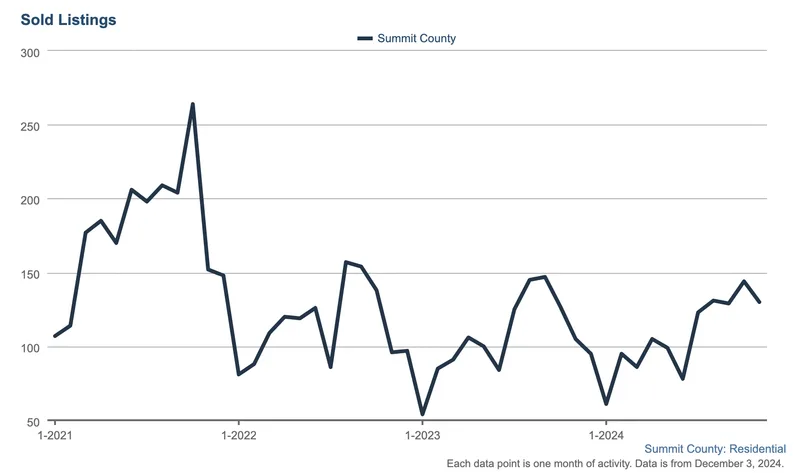
September had 129 sales, only two less than August’s 131. Staying pretty steady.
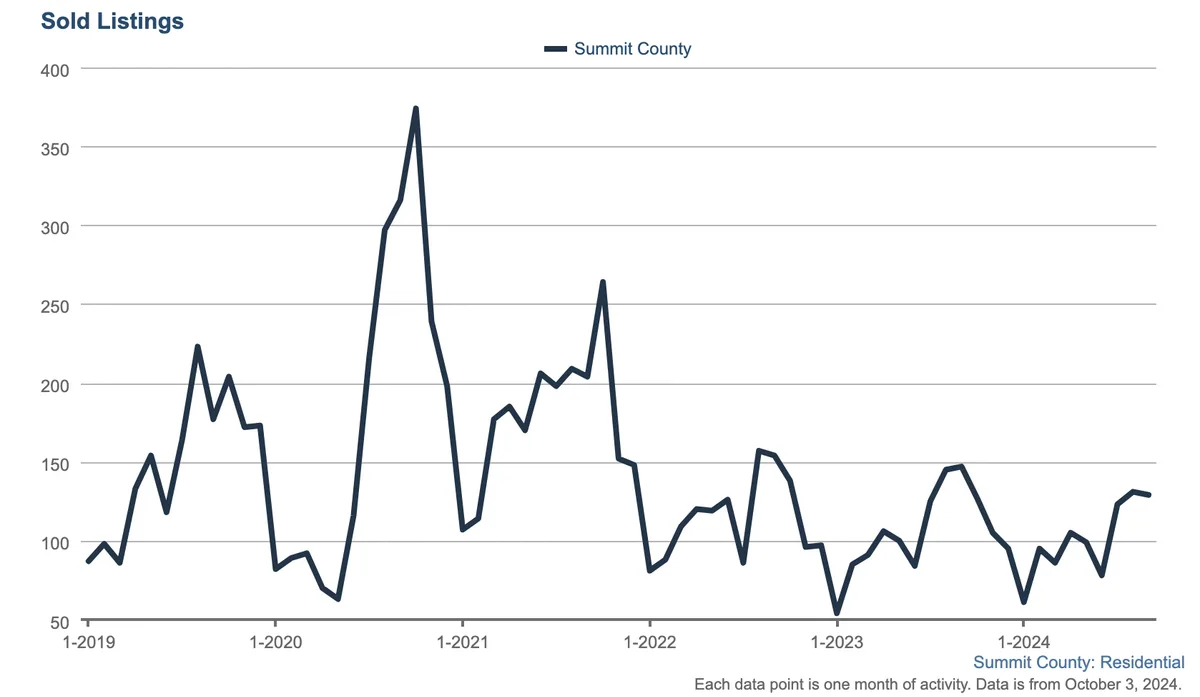
Line graph showing monthly sold residential listings in Summit County from 2019 to 2024, with a sharp peak in early 2021 and fluctuating values between 50 and 400 listings throughout the period.

Median/Average Price

Since May, the median price has been incredibly stable, right at $1.05m, looking at 6 month trailing data.
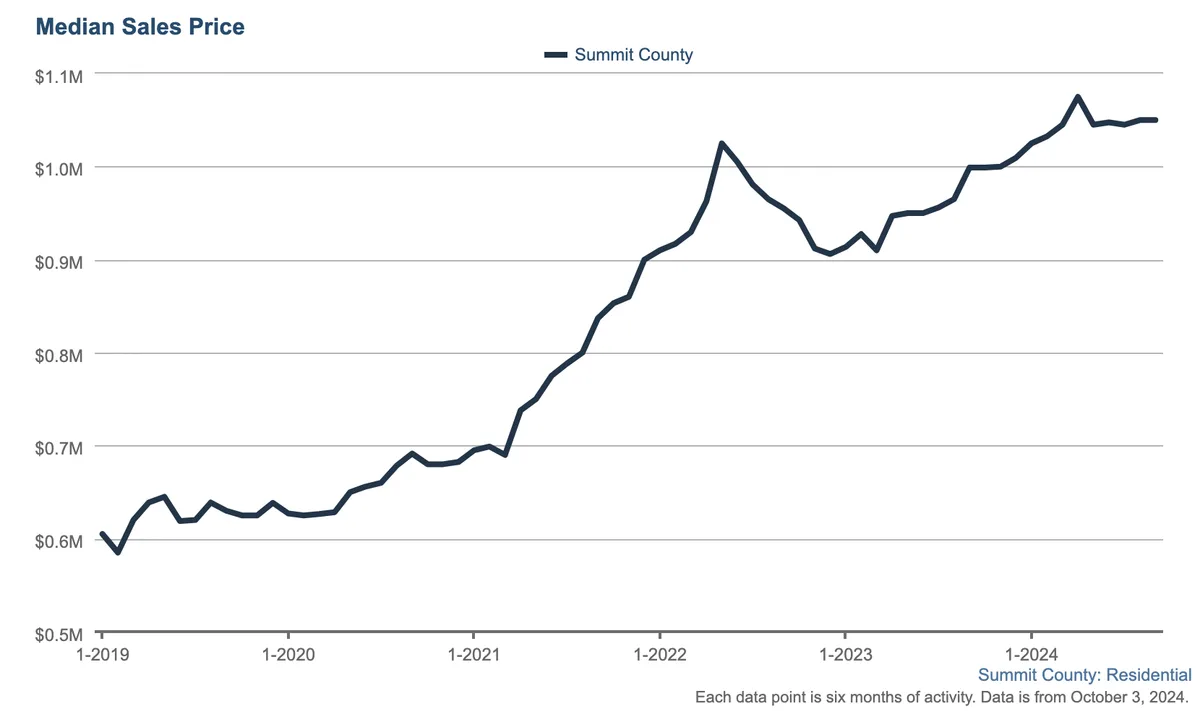
Line graph showing Summit County median home sales prices rising from about $0.6M in early 2019 to over $1.1M in 2024, with notable increases starting in 2021 and some fluctuations after.

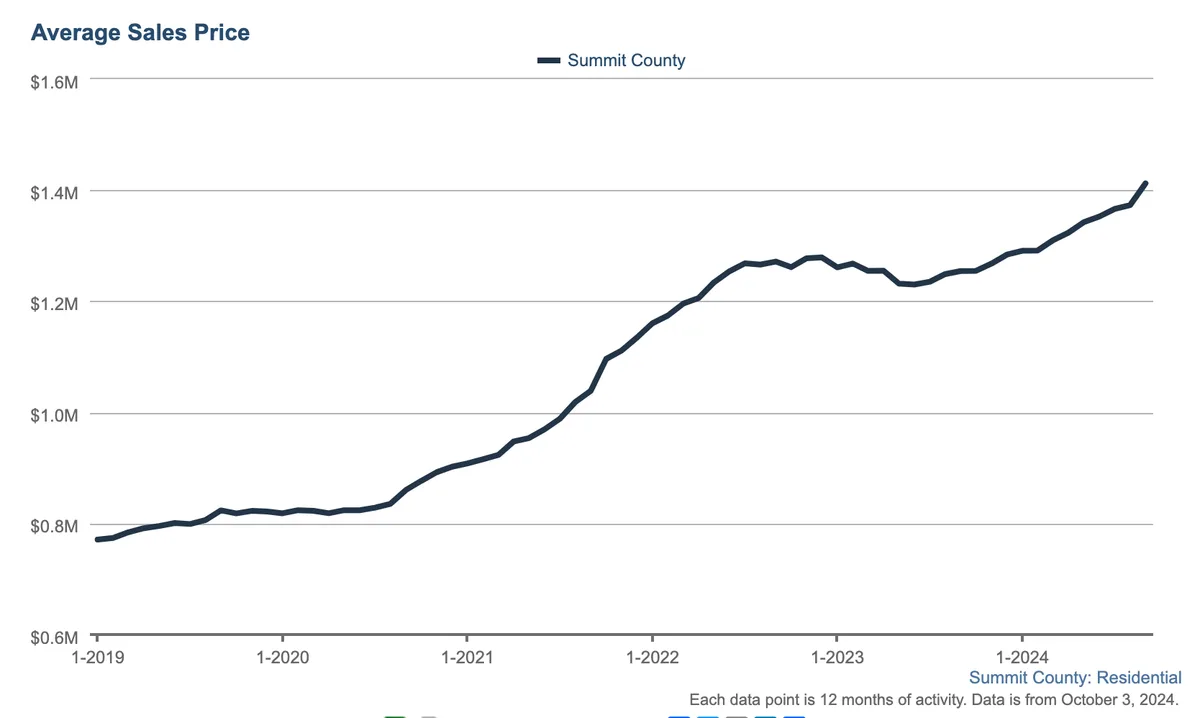
Average pricing picked up in September, indicating higher priced units selling in September. Some of the Alcove units in Keystone closed so that, along with other luxury sales, are pushing up the average pricing.
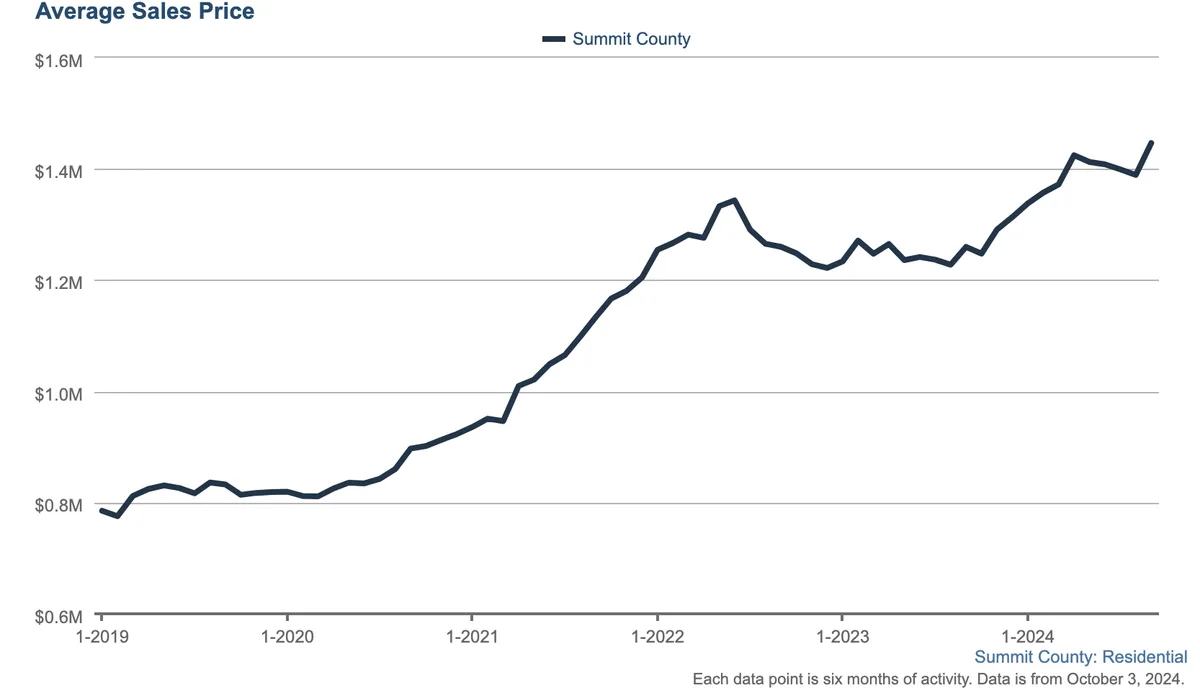
Line graph showing average sales price in Summit County rising from about $0.7M in early 2019 to over $1.4M by late 2024, with steady growth and some fluctuations along the way.

Also see trailing 12 months to show the strength of sales prices.

Median:
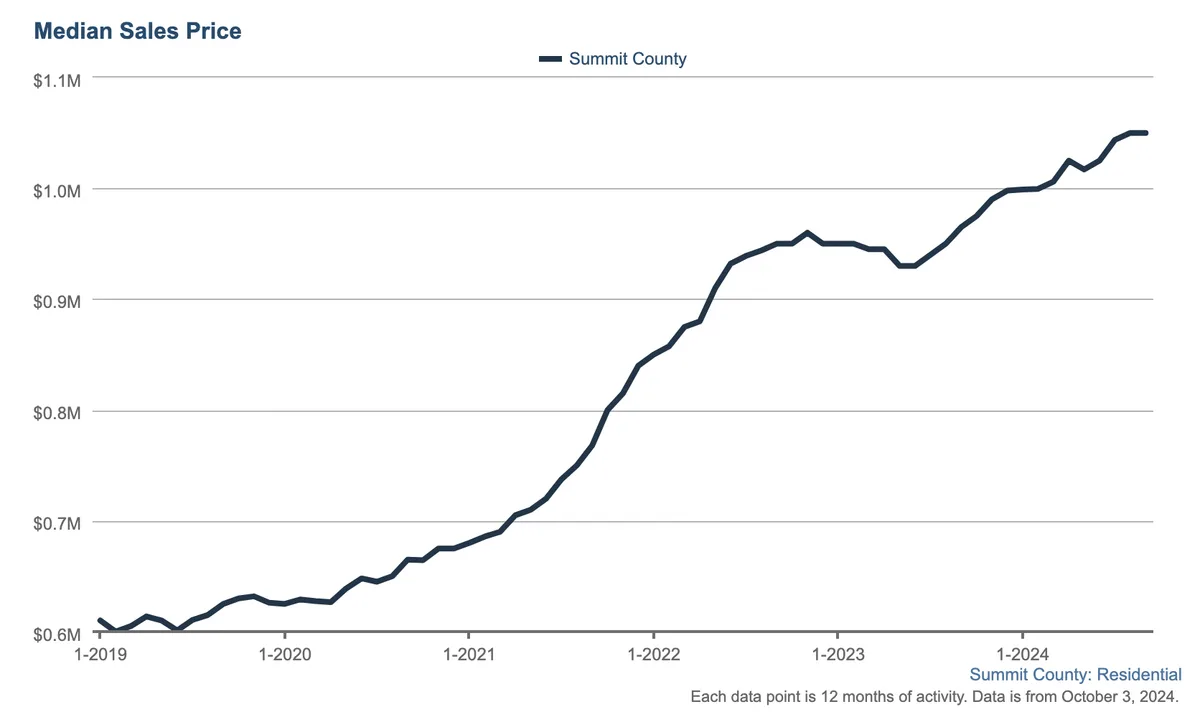
Line graph showing Summit County median home sales prices rising from about $600K in early 2019 to over $1M in late 2024, with steady increases and some fluctuations throughout the period.

Average:

Line graph showing average home sales prices in Summit County rising from about $700K in early 2019 to nearly $1.5M by October 2024, with steady growth and a notable increase in 2021-2022.

Days on Market

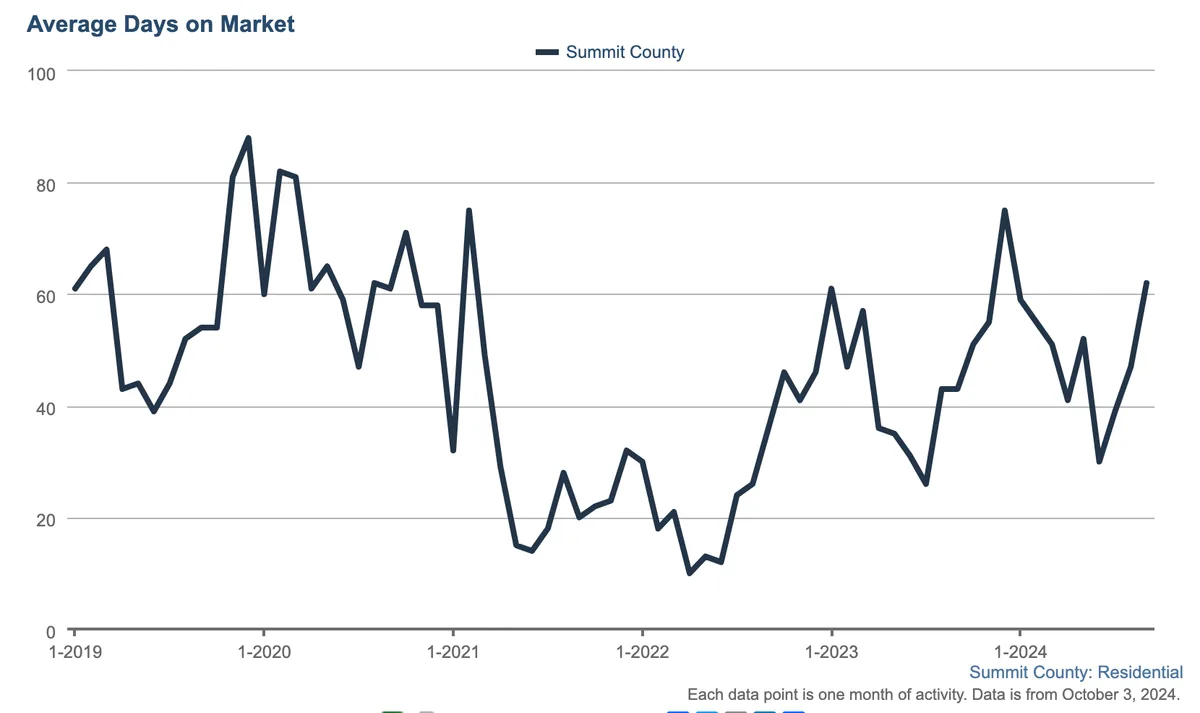
Median and Average Days on Market jumped in September as summer listings continue to stay on the market.

Median DOM is 37:
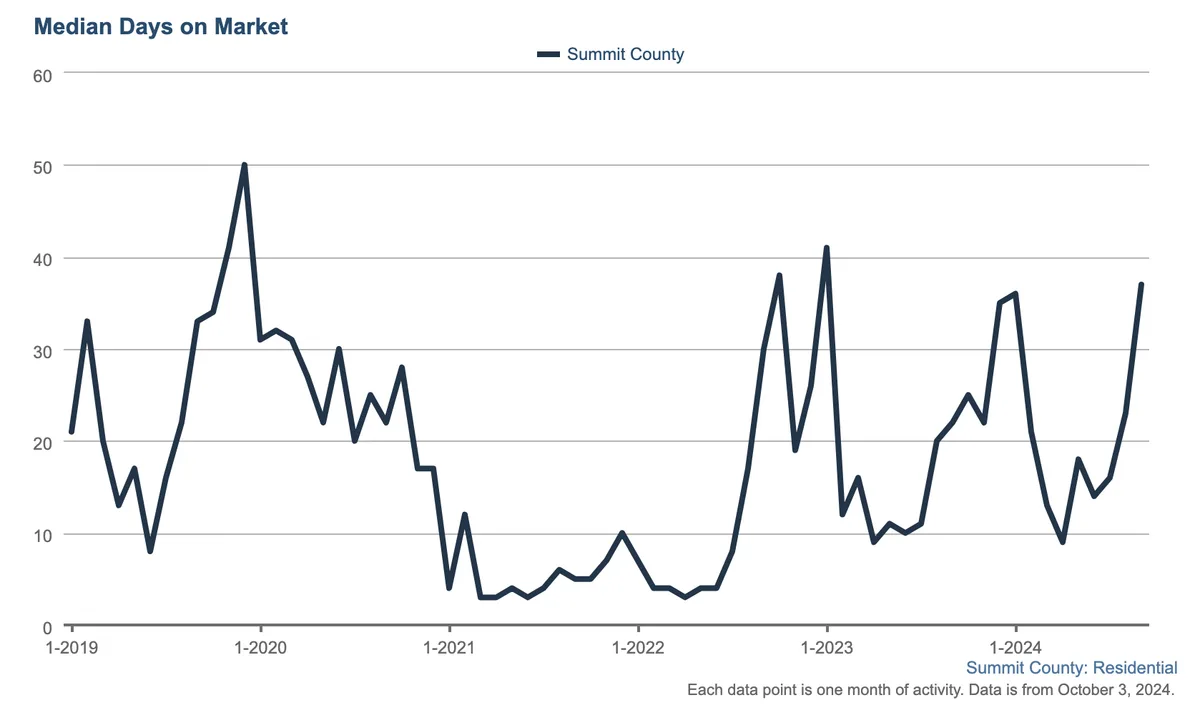
Line graph showing median days on market in Summit County from 1-2019 to 9-2024, with fluctuations and peaks around late 2020, early 2023, and mid-2024, reaching around 40 days at the end.

Average DOM is 62:

Line graph showing average days on market for Summit County residential homes from early 2019 to late 2024, with fluctuations between about 20 and 90 days over the period.

Pending Sales

In September 163 properties went under contract indicating that the number of sales will remain steady.
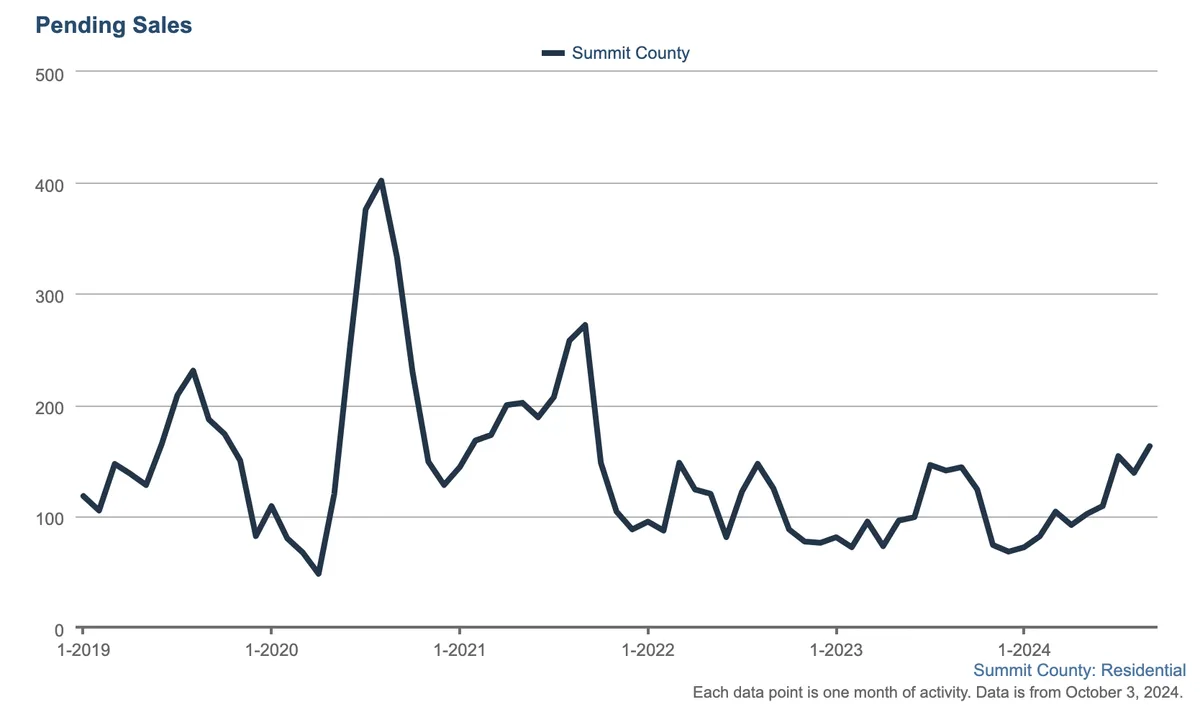
Line chart showing monthly pending home sales in Summit County from early 2019 to early 2024, with peaks in 2020 and 2021, followed by fluctuating but lower values through 2024.

Active Listings

Active listings dropped to 646 which will ease competition a bit. However, we are also entering slower sales season so expect less buyers and less showings
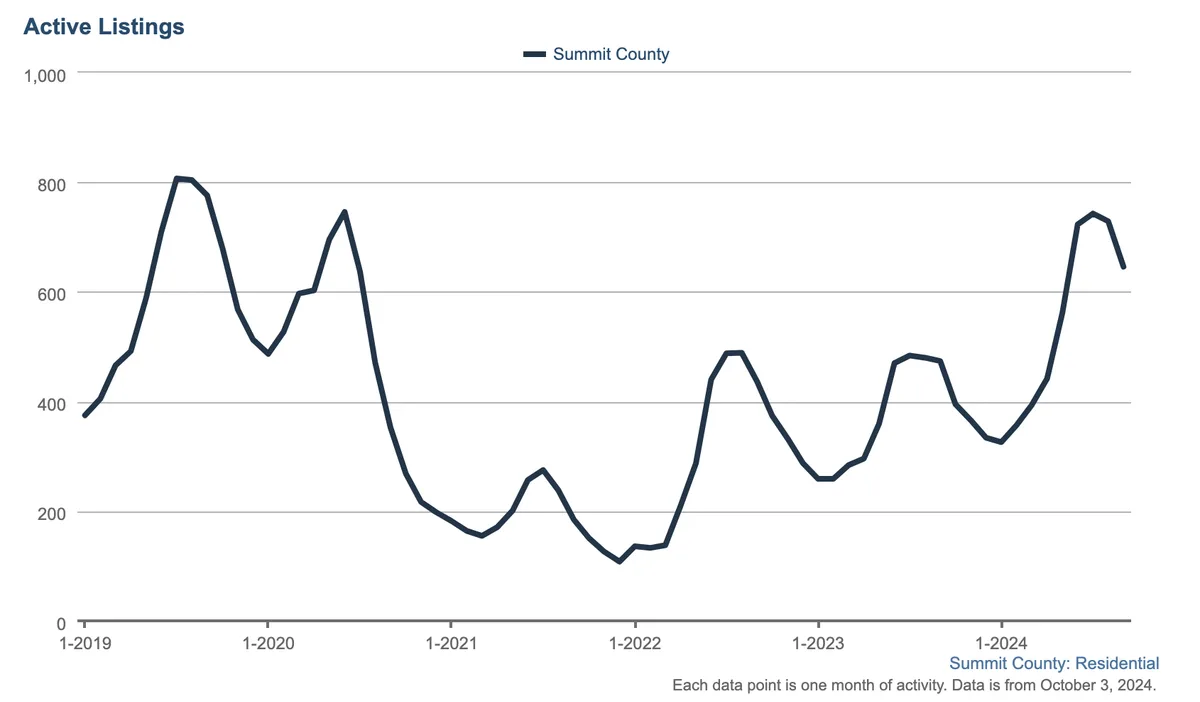
Line graph showing active residential listings in Summit County from January 2019 to October 2024, with peaks above 800 and lows around 200, displaying seasonal fluctuations over time.

Market Updates ·

November 2024 Market Report

130 Residential Sales in November: Last month was 144. 99 Pending properties in November Last month 135 properties went under contract. There will be less…

By Amy Nakos

Market Updates ·

December 2024 Market Report

While average pricing didn’t show any softening in the market, those stats are pulled up by higher priced luxury properties which sold at a good pace in 2024…

By Amy Nakos

Market Updates ·

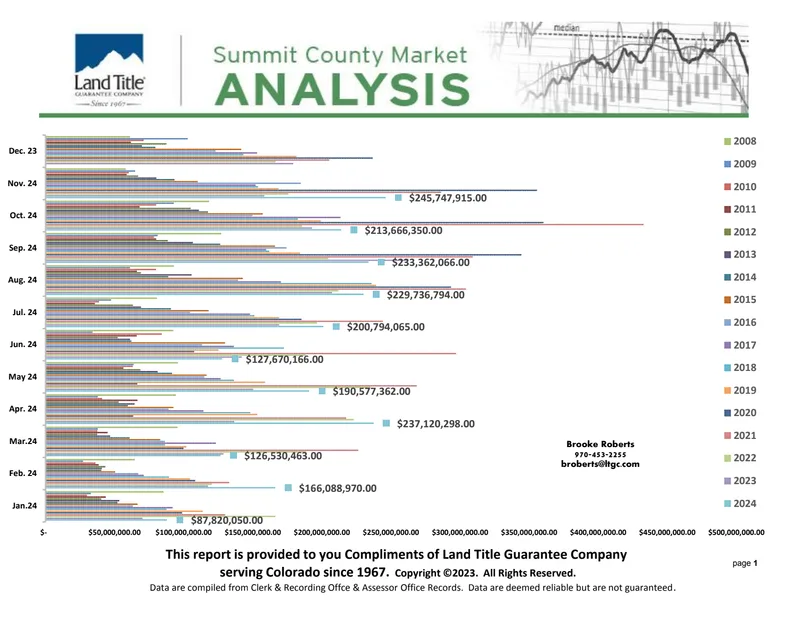
Land Title December 2024 Market Analysis

Here is the Land Title Report from November 2024. The full year report will be provided in next month’s newsletter. November real estate was up 55% with…

By Amy Nakos

Thinking about a move in Summit County?

Whether you are buying a second home, selling, or running the numbers on an investment, start with a conversation.