
Market Updates

November 2024 Market Report

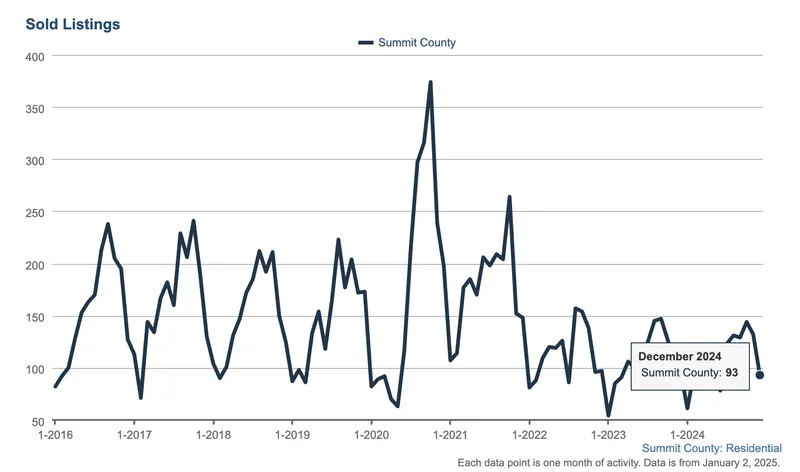
130 Residential Sales in November:
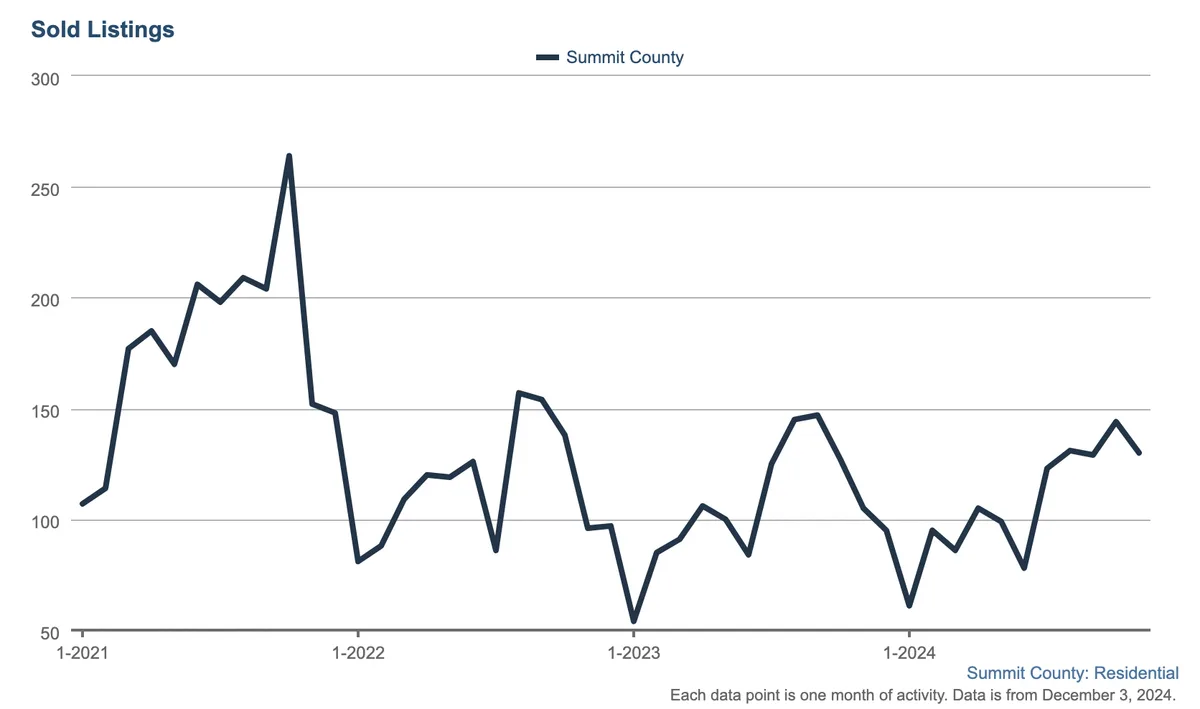
Line graph showing monthly sold listings in Summit County from January 2021 to December 2023, peaking above 250 in early 2022, then fluctuating between about 75 and 175 through 2023.

Last month was 144.

99 Pending properties in November
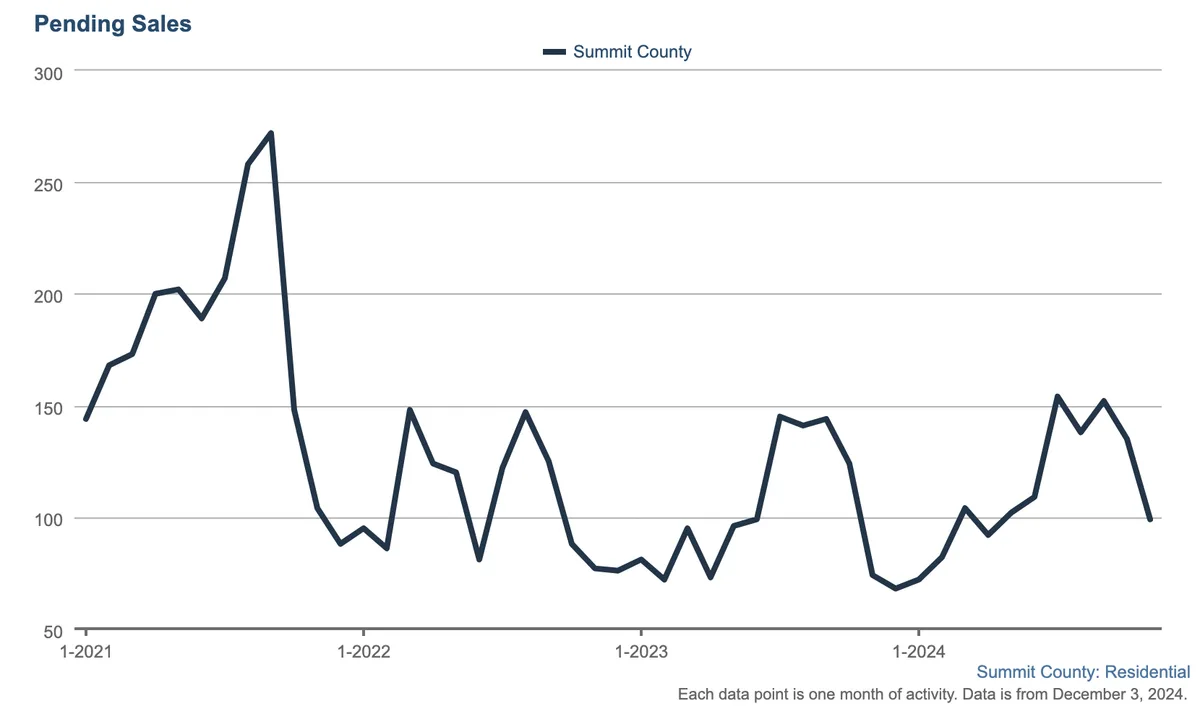
Line graph showing Summit County residential pending sales from January 2021 to December 2024. Peak in early 2021, then fluctuating between 50 and 150, with a slight rise at the end.

Last month 135 properties went under contract. There will be less closings given this decline in pending sales.

November showings per listing is 1.8 down from 2.8 in October.
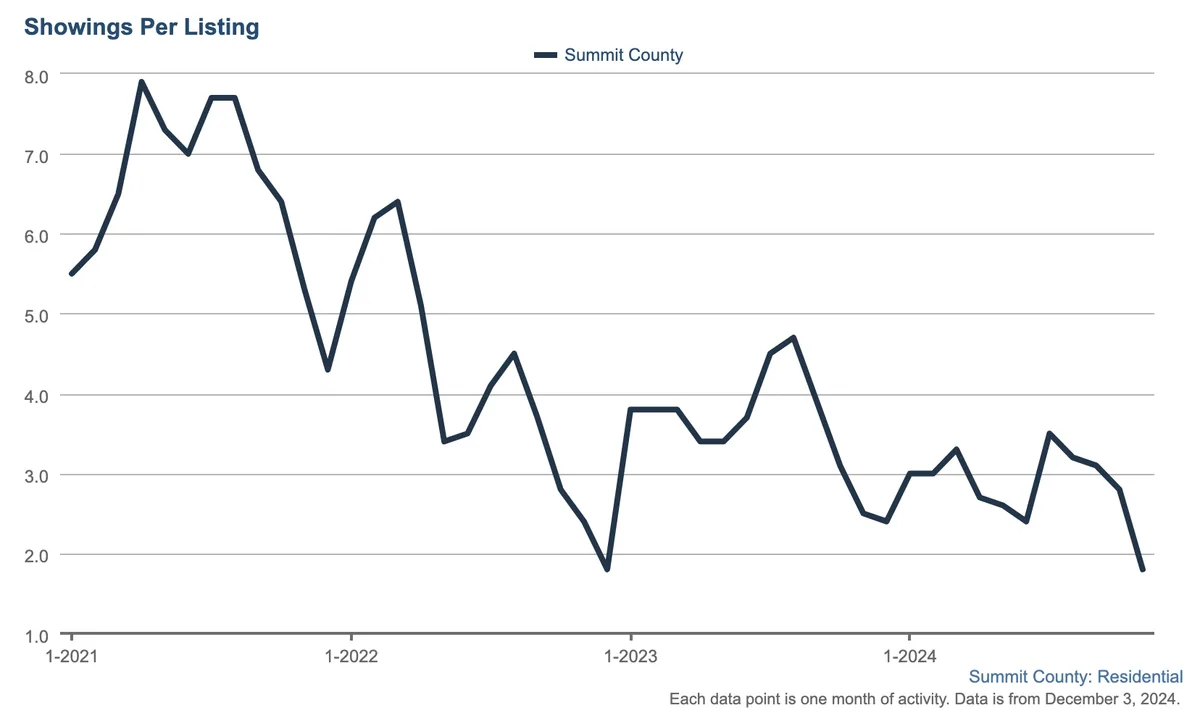
Line graph showing monthly showings per real estate listing in Summit County from January 2021 to December 2024. The trend declines from around 7 to about 2 showings per listing.

This time of year is generally slower given the holidays. Expect sales to be lower in the next few months and things will pick up again in the spring.

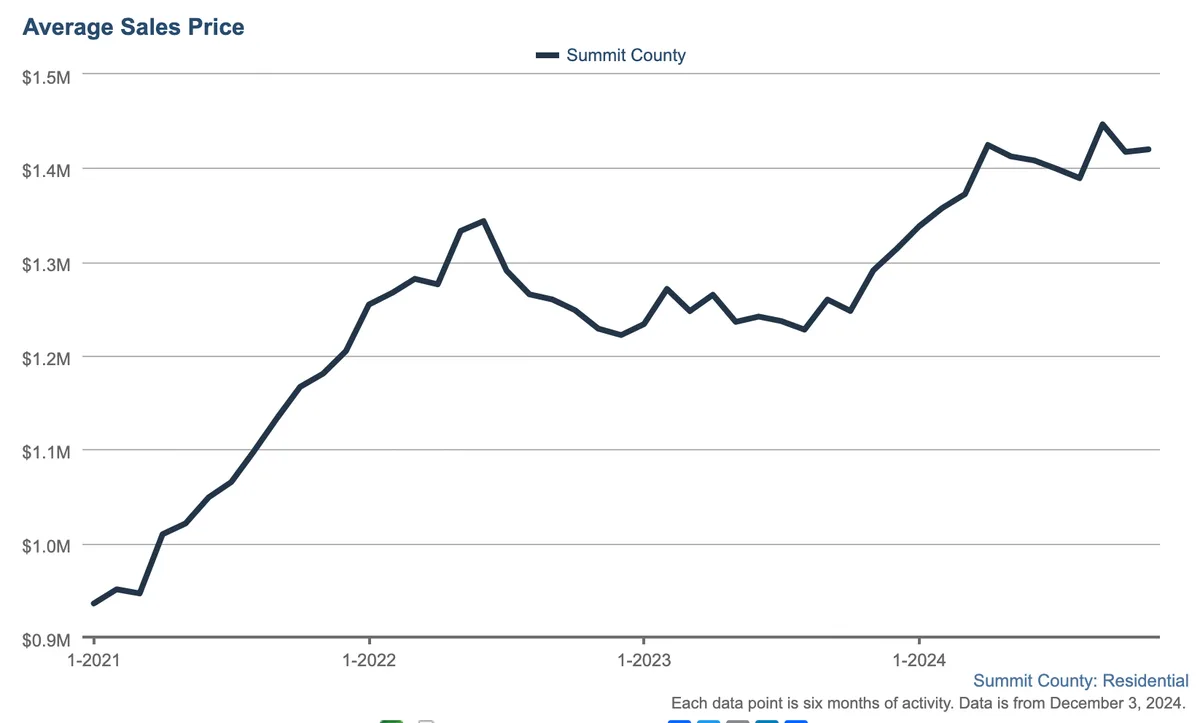
Median and Average Pricing (Trailing 6 months) remains steady.
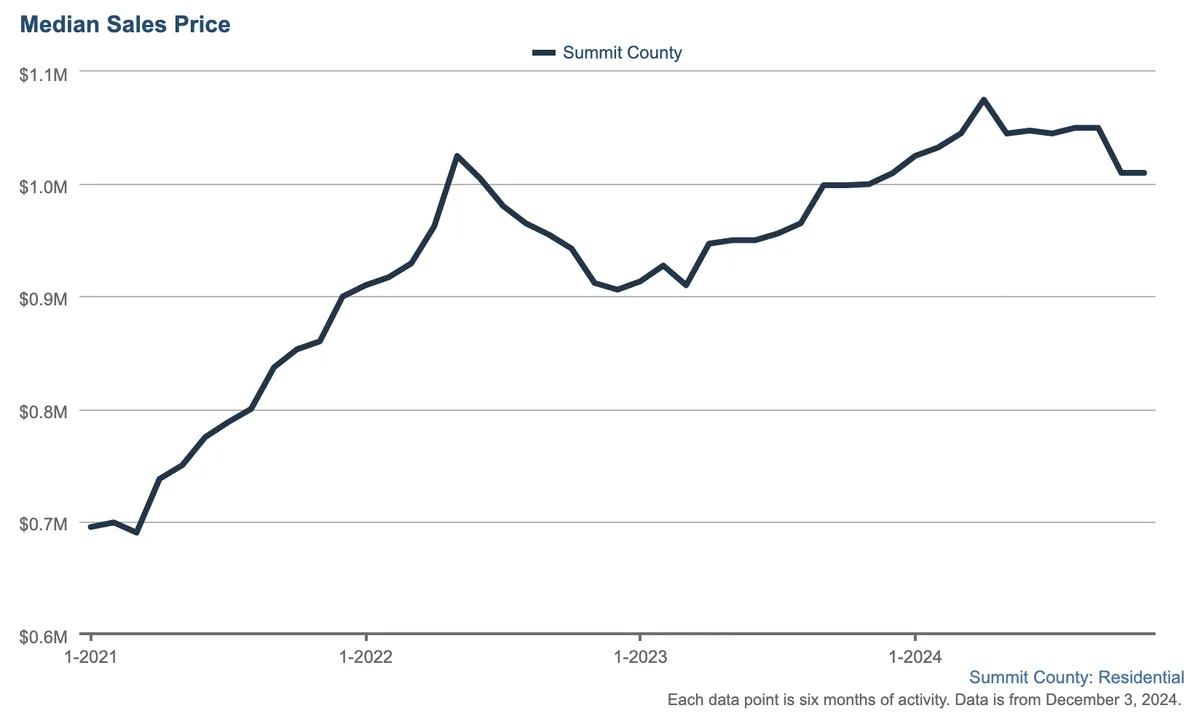
Line graph showing Summit County median home sales prices from $0.7M in early 2021, peaking near $1.1M in 2023, then declining slightly by late 2024.

Line graph showing average residential sales price in Summit County from Jan 2021 to Dec 2024, rising from about $950K to around $1.4M, with some fluctuations after a peak in early 2023.

Market Updates ·

December 2024 Market Report

While average pricing didn’t show any softening in the market, those stats are pulled up by higher priced luxury properties which sold at a good pace in 2024…

By Amy Nakos

Market Updates ·

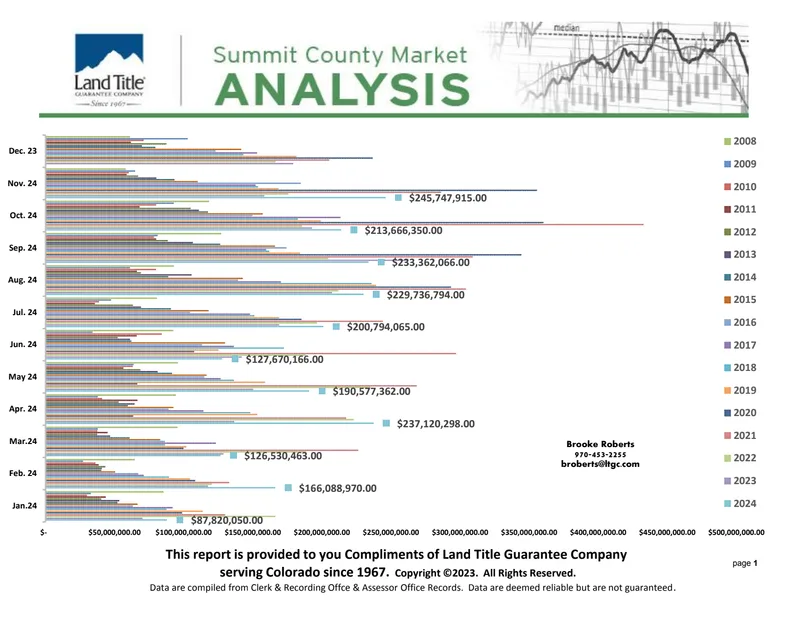
Land Title December 2024 Market Analysis

Here is the Land Title Report from November 2024. The full year report will be provided in next month’s newsletter. November real estate was up 55% with…

By Amy Nakos

Thinking about a move in Summit County?

Whether you are buying a second home, selling, or running the numbers on an investment, start with a conversation.