
November 2020 Market Stats
Market Stats
Summit County’s real estate market is a classic economics tale of low inventory and high demand. You will see that the inventory numbers from September 2019 to 2020 dropped to less than half. This creates more demand and increasing prices. Prices are up an average of 15-29% over last year’s prices.
A Seller’s Market
If you are a Seller, I personally have never experienced a better time to sell in my 18+ years of being a real estate professional. If you are a buyer, you should talk to me about how to maximize your chances of getting your offer accepted. It’s a battlefield out there for buyers, and having all your ducks in a row pays off.
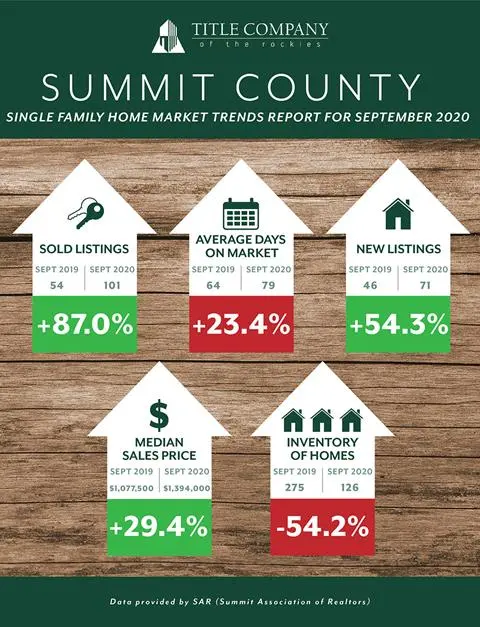
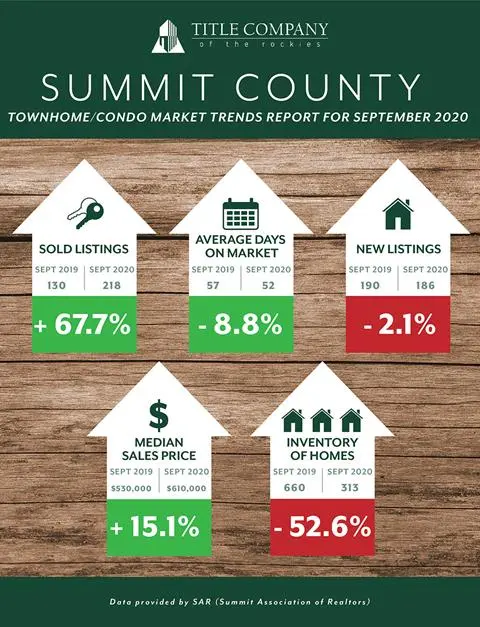
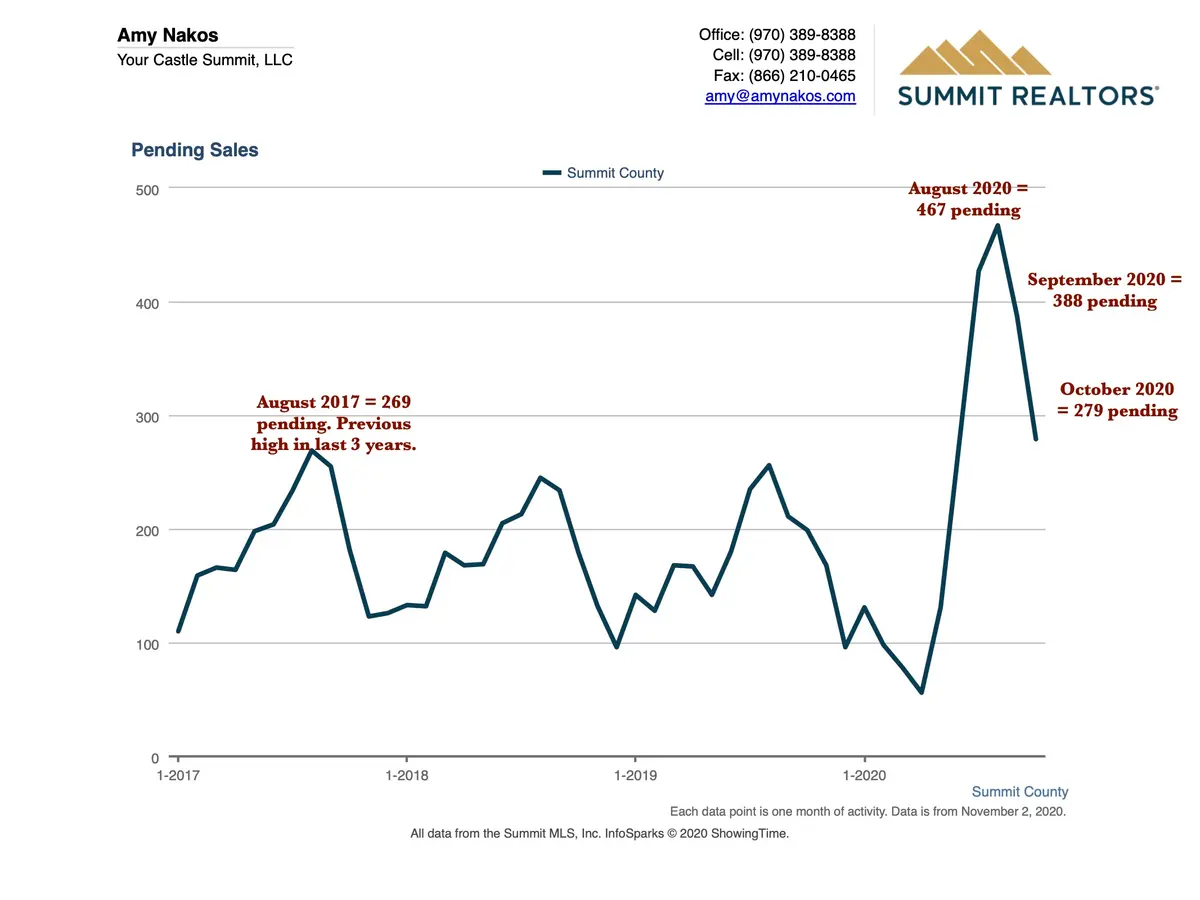
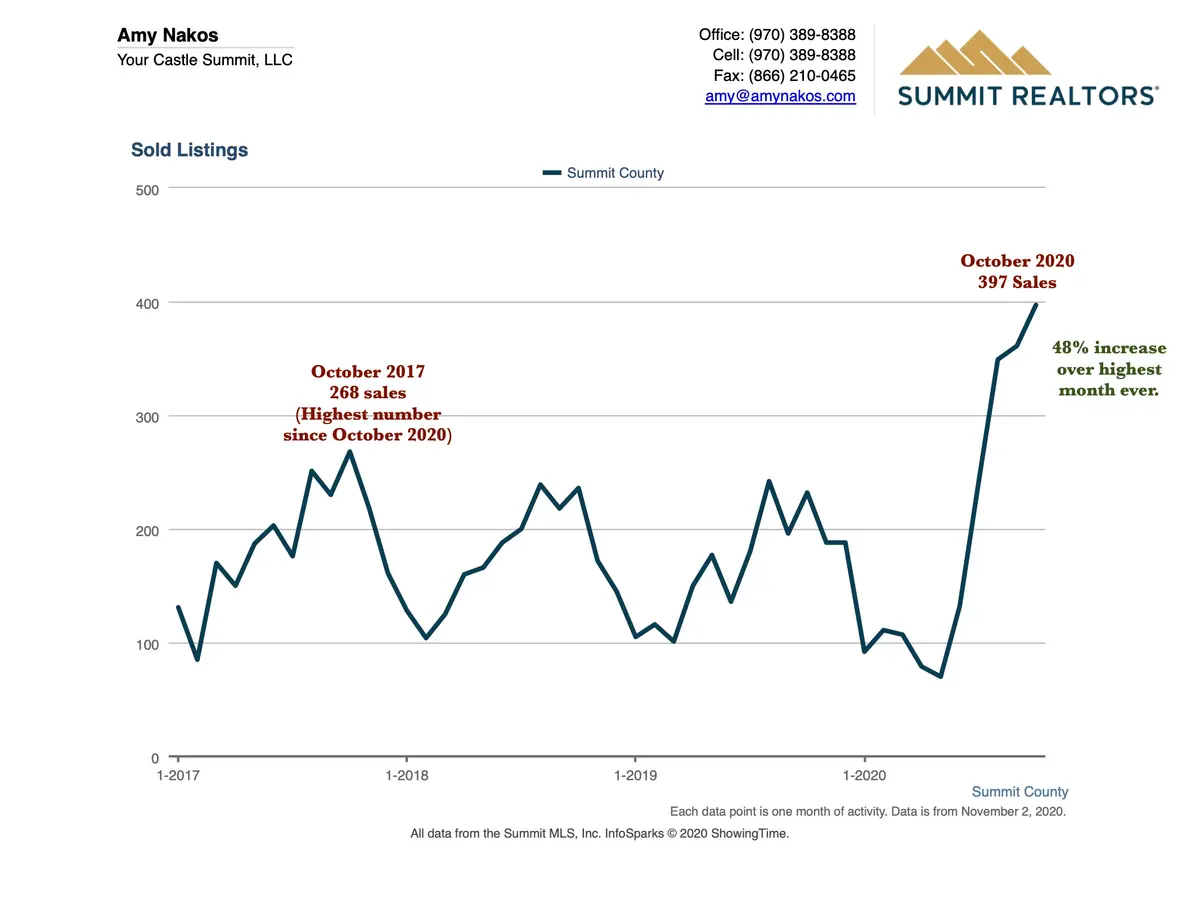
The sheer volume of transactions from this Summer and Fall are illustrated by the charts below. You will see the the number of Sold and Pending properties broke records from the previous 3 years, almost doubling.
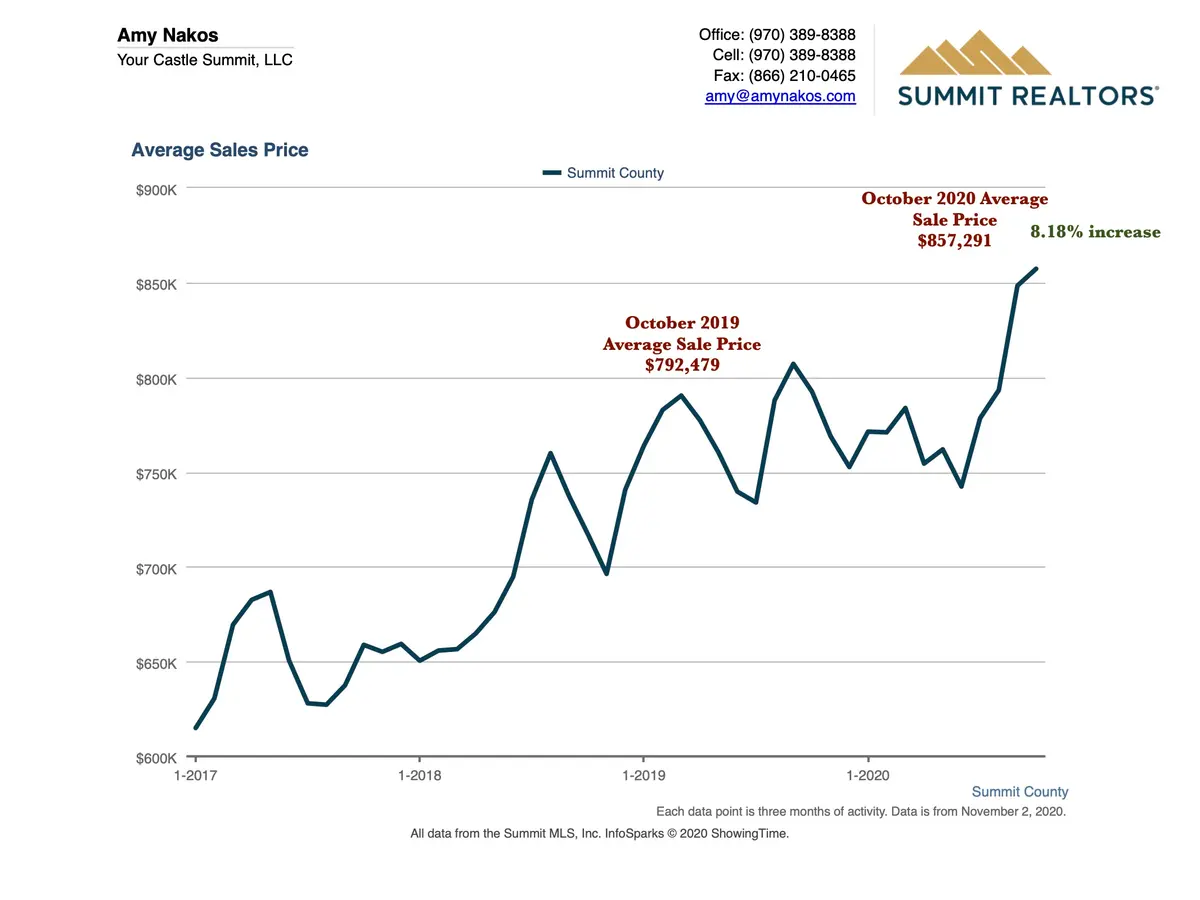
Average price of all properties sold from October 2019 to October 2020 was up over 8%, although we are seeing much higher increases in some sectors.
Average Sales Price
Sold Listings
Pending Sales