
Market Updates

Market Update: April 2024

We are preparing for the summer selling season at The Amy Nakos Group. We are looking to add approximately 10-15 listings in May and June. If other brokerages are also preparing to release new listings, we could see some great new inventory hitting the market soon.

The market continues to hold steady and is experiencing continued pricing increases. When inventory increases in the spring, we will see days on market decrease and new properties will bring down the average days on the market. Don’t be fooled by that number indicating that properties are selling faster, it just means more properties have lower DOM, bringing down the average.

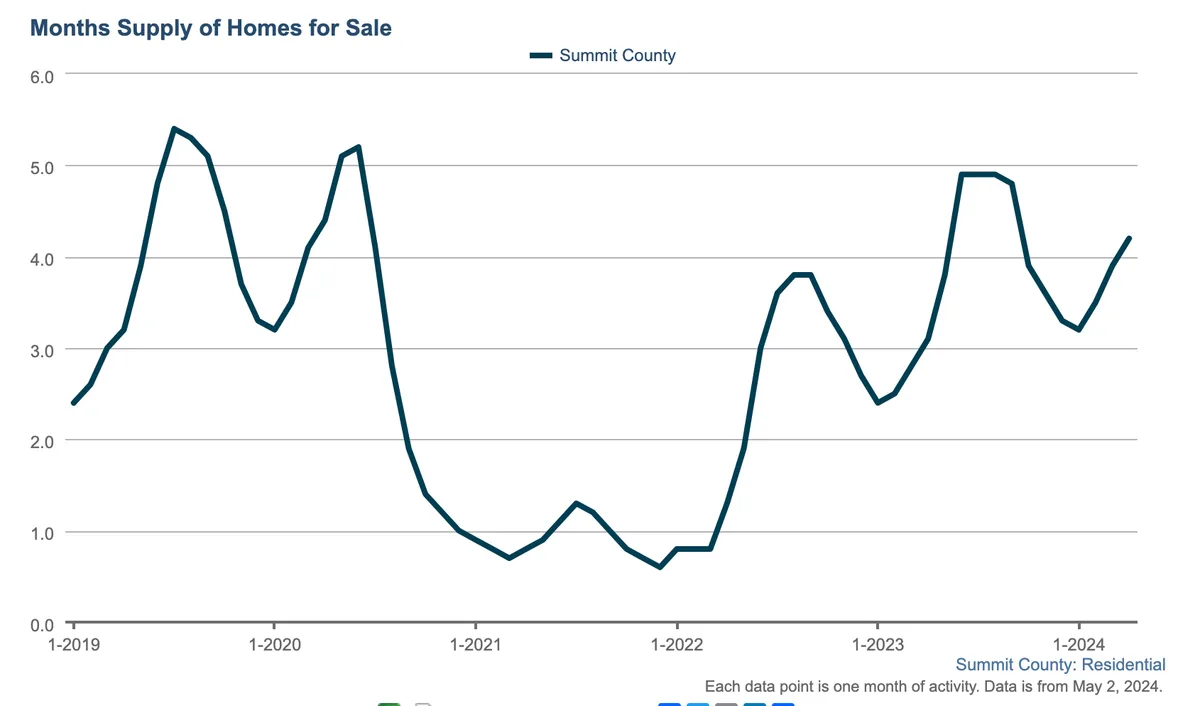
You will also see that absorption numbers (months of inventory) will increase as inventory grows in the spring before the selling season. Again, don’t consider the MOI as a hard and fast number since the summer selling season will determine the pace of sales. By October or November, we will be able to gauge the strength of the overall market with statistics from the summer.

As for now, pricing and inventory are steady. We shall see what the summer brings!

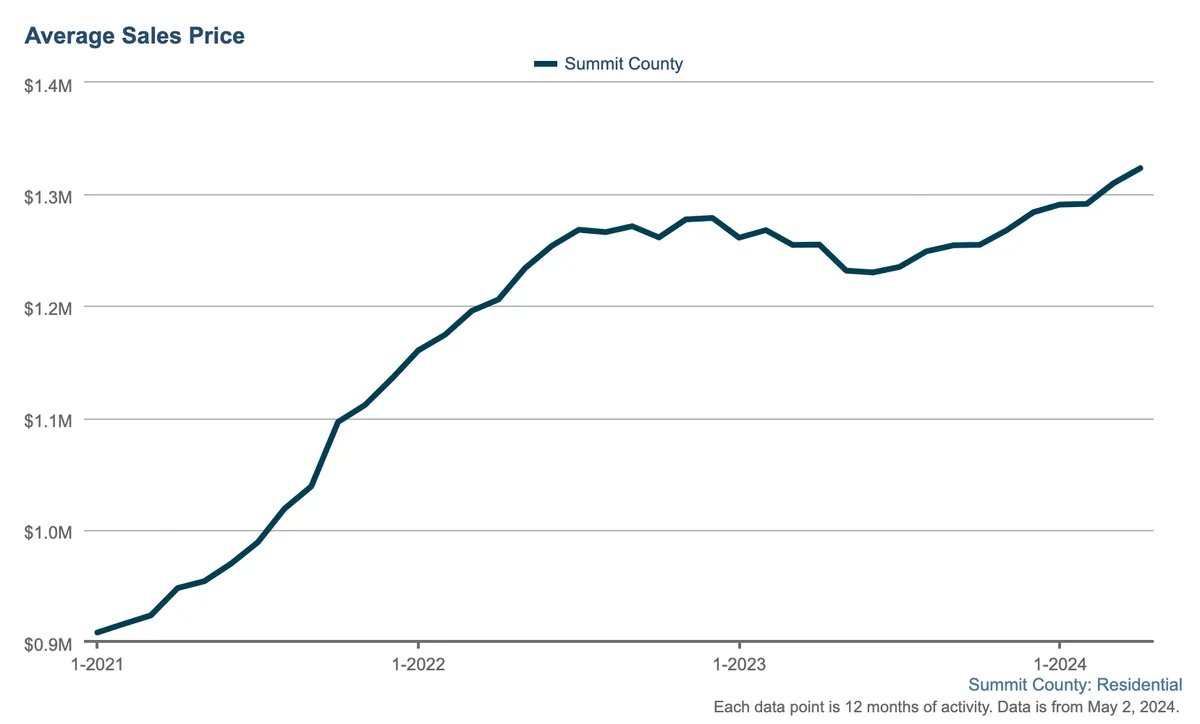
Average Sales price (Trailing 12M)

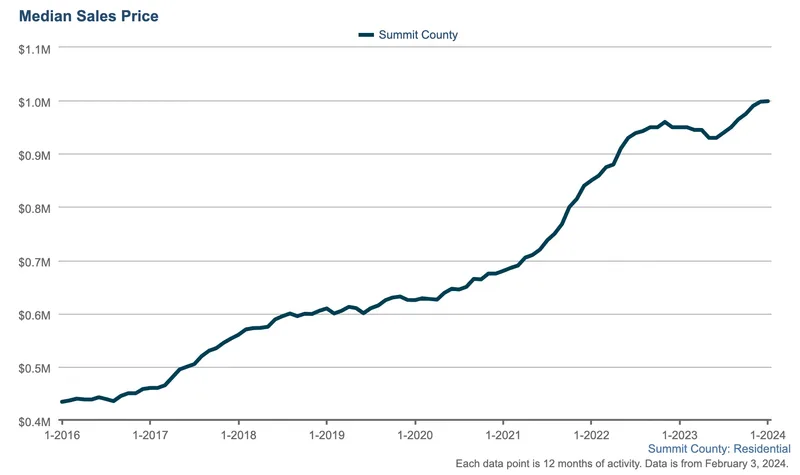
Median April: $1,025,000, up from $1,006,000 in March – +1.88%
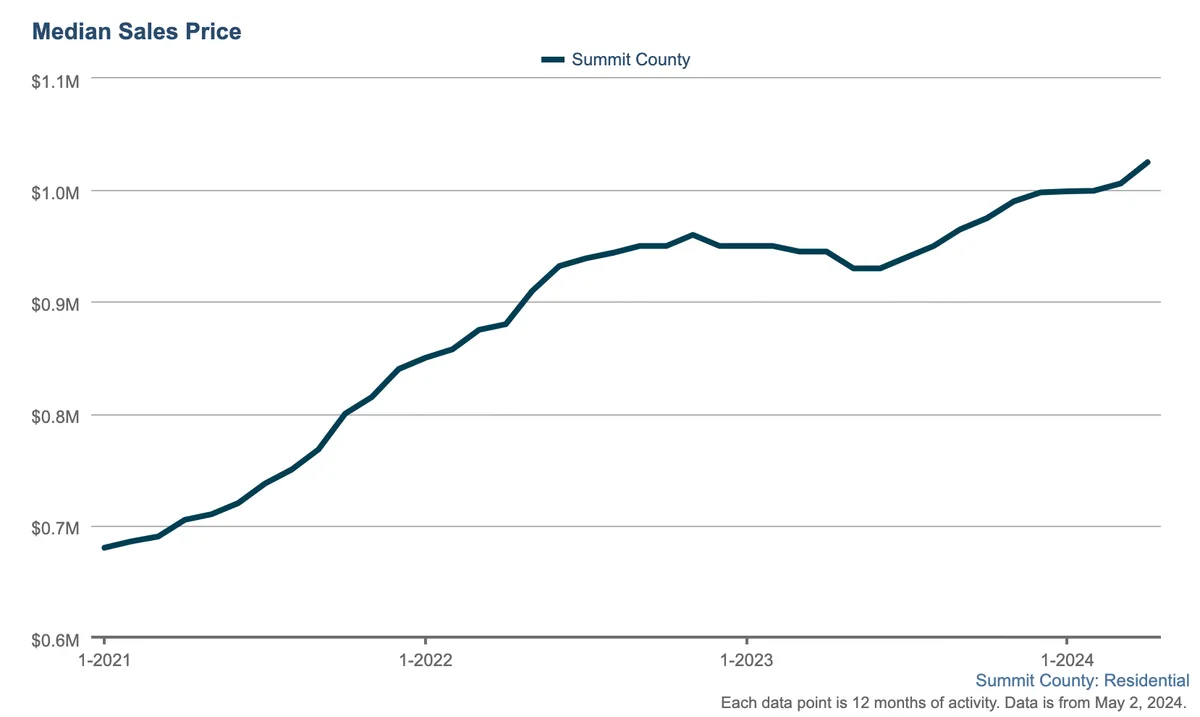
Line graph showing Summit County median residential sales prices rising from about $650k in early 2021 to over $1M by May 2024, with steady growth and brief plateaus mid-2023.

Average April: $1,323,461, up from $1,309,992 ​​​​​​​in March +1.02%

Line graph showing average residential sales price in Summit County rising from about $0.9M in early 2021 to over $1.3M in early 2024, with minor fluctuations after mid-2022.

I also looked at Median and Average sales prices from April 2023 to compare year over year:

Median April 2023: $945,000

Median April 2024: $1,025,000

**+8.46%
**

Average April 2023: $1,255,062

Average April 2024: $1,323,461

+$5.44%

These are still impressive appreciation increases given higher interest rates, and a post-COVID, slower marketplace. As I tell new prospective buyers, lack of inventory and almost zero room for expansion will keep pricing high.

There are 435 Active Listings in April (obviously this changes day to day – just what the stats are showing).
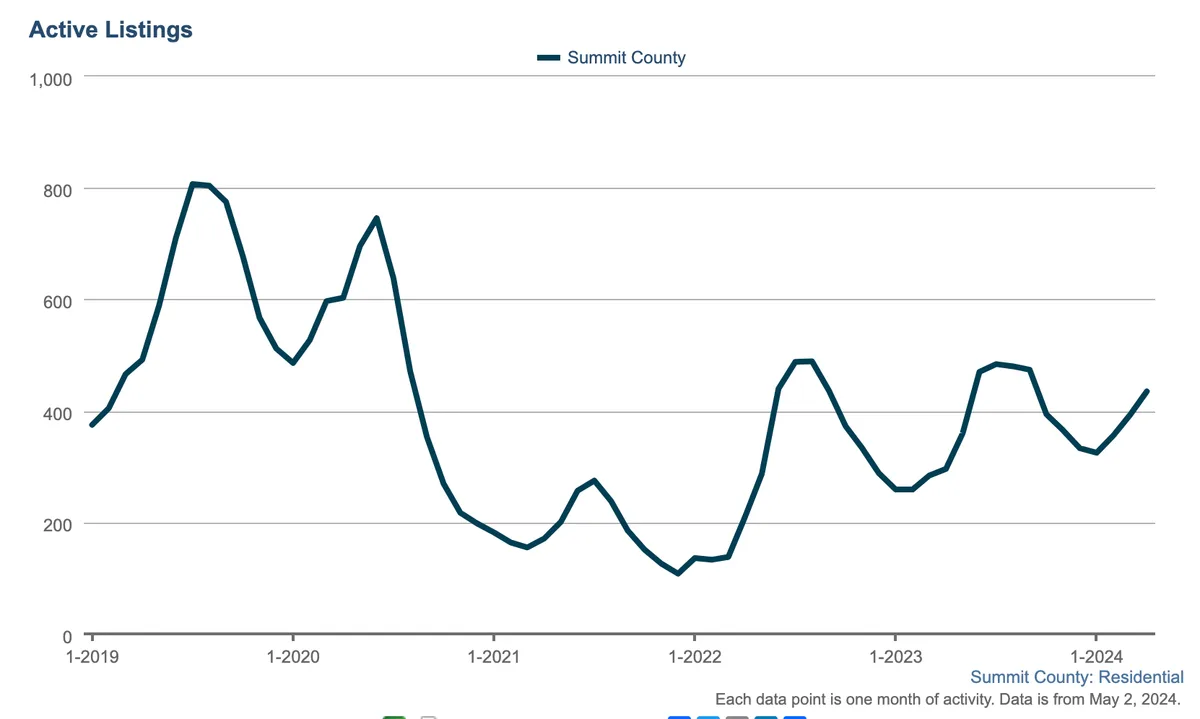
Line graph showing monthly active residential listings in Summit County from 2019 to 2024. Listings peak near 900 in mid-2019 and fluctuate, dropping below 300 in early 2022 and ending near 400 in 2024.

In April 98 residential properties in Summit went under contract
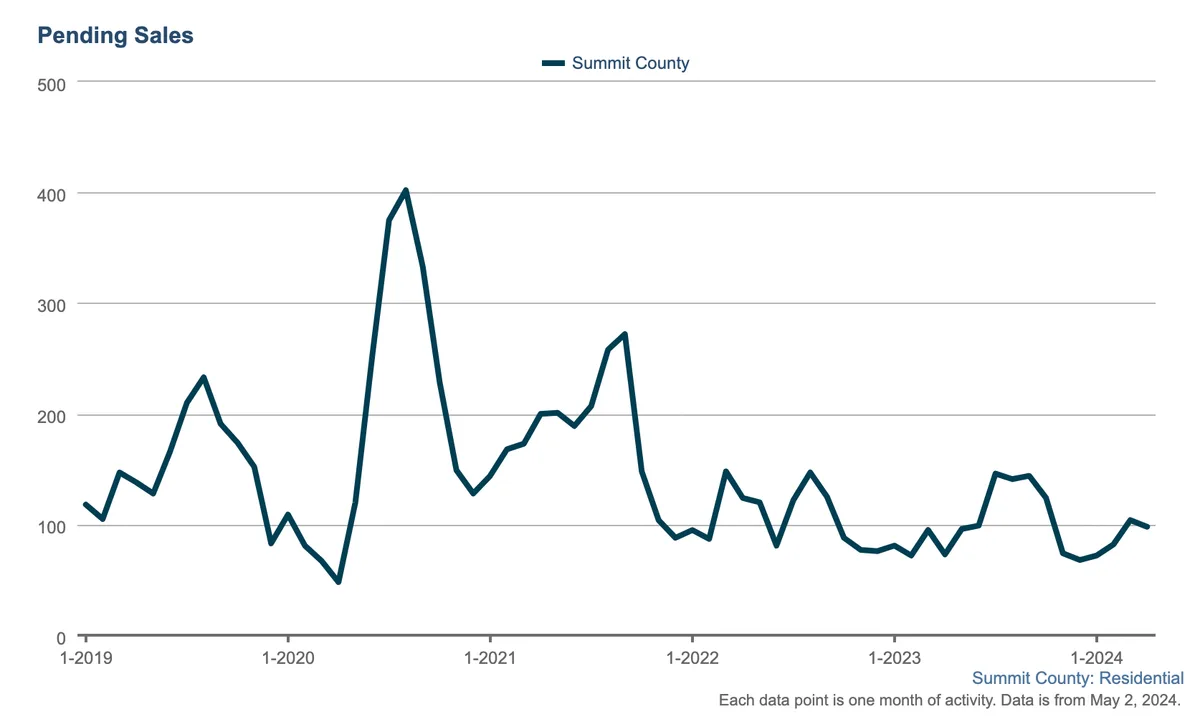
Line graph showing monthly pending residential sales in Summit County from Jan 2019 to Jan 2024, peaking around 2020 and fluctuating before stabilizing at lower levels from 2022 onward.

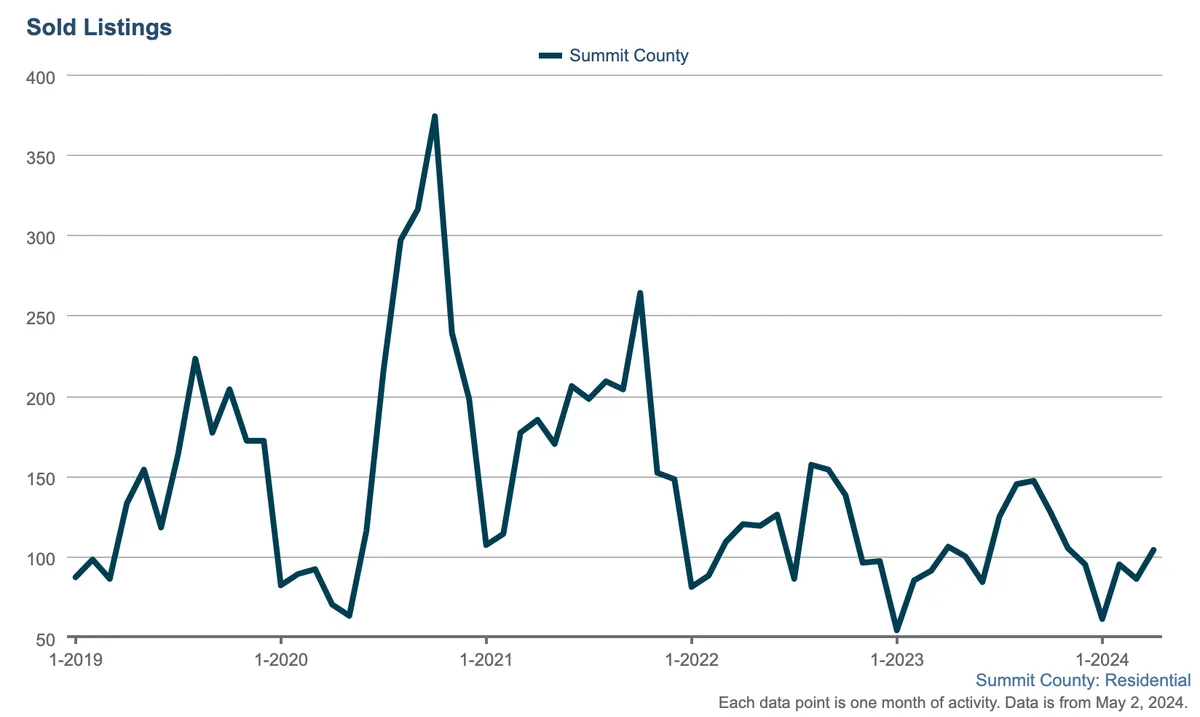
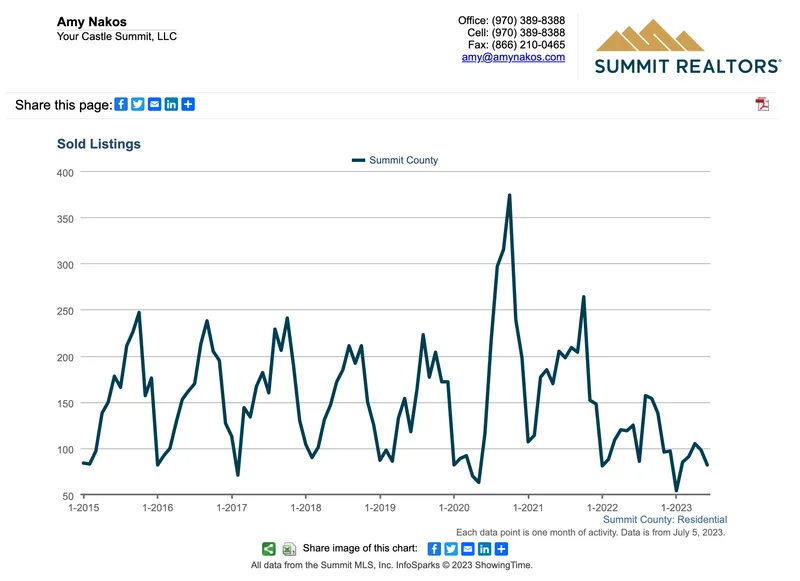
One hundred and four properties sold i​​​​​​​n April.

Line graph showing monthly sold listings in Summit County from early 2019 to early 2024, peaking in early 2021 and fluctuating with smaller peaks and valleys throughout the period.

Average days on market in April is 41.
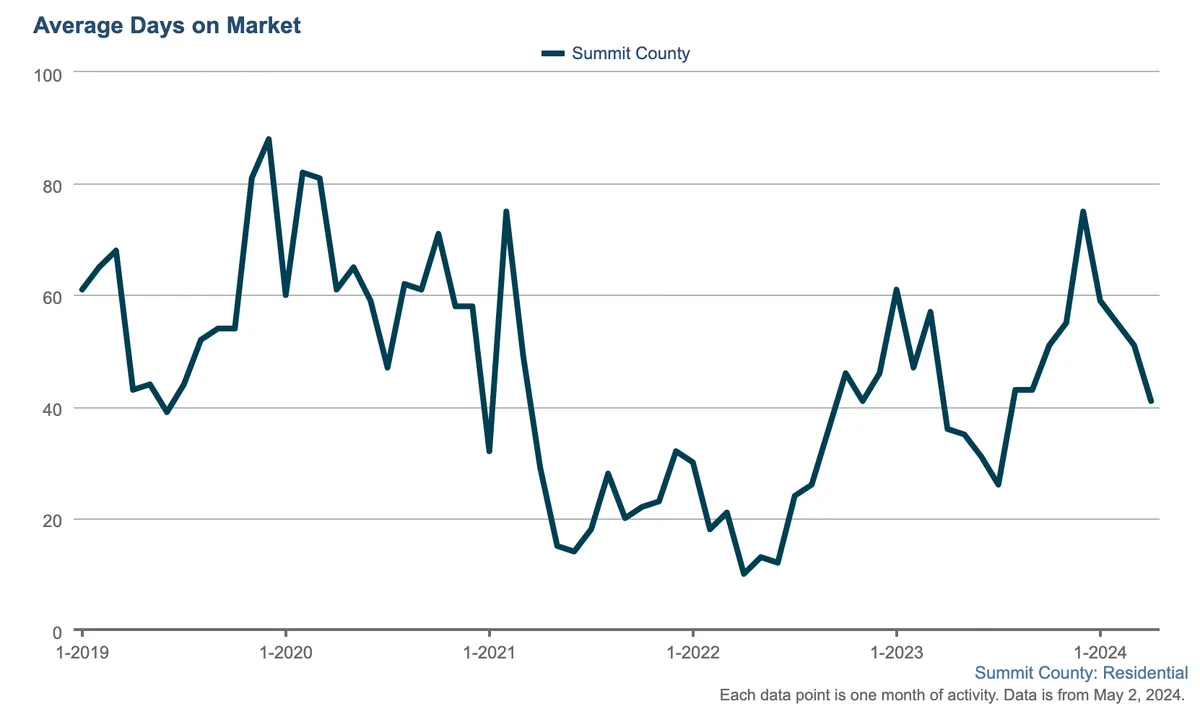
Line graph showing Average Days on Market in Summit County from January 2019 to early 2024, with peaks above 80 days and lows near 20 days. The data fluctuates frequently throughout the period.

April showed 4.2 months of supply.

Line graph showing months supply of homes for sale in Summit County from 2019 to early 2024, fluctuating between about 1 and 5.5 months, with notable peaks and valleys throughout the time period.

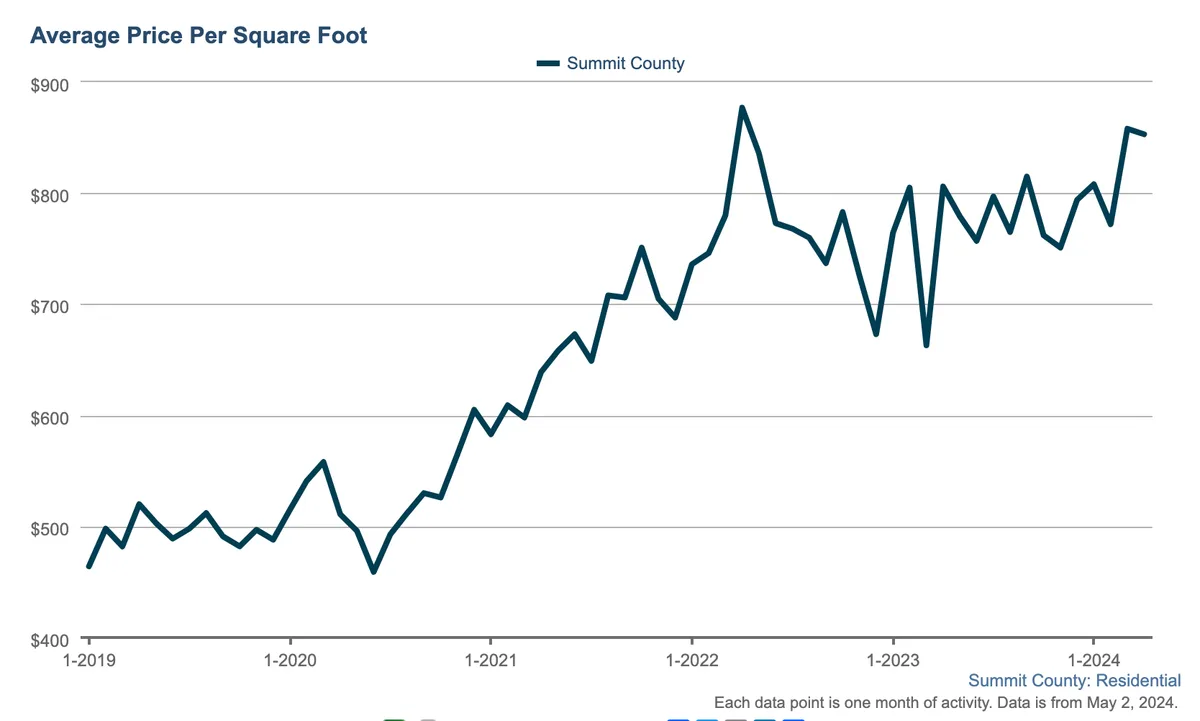
Median price per square foot for April sales is $815
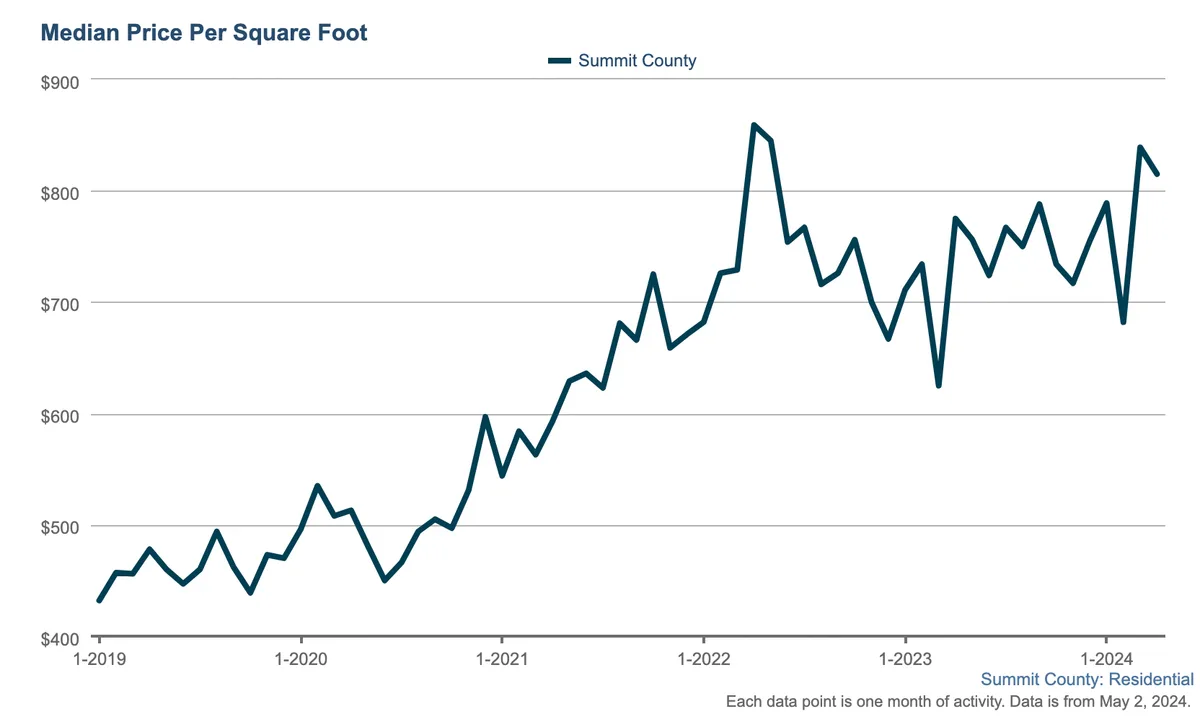
Line graph showing median price per square foot in Summit County from early 2019 to early 2024, rising from about $450 to peaks near $850, with some fluctuations throughout the period.

Median price per square foot​​​​​​​ for April sales is $815

Line graph showing average price per square foot in Summit County rising from about $400 in early 2019 to over $800 by 2024, with a peak near $900 in early 2022.

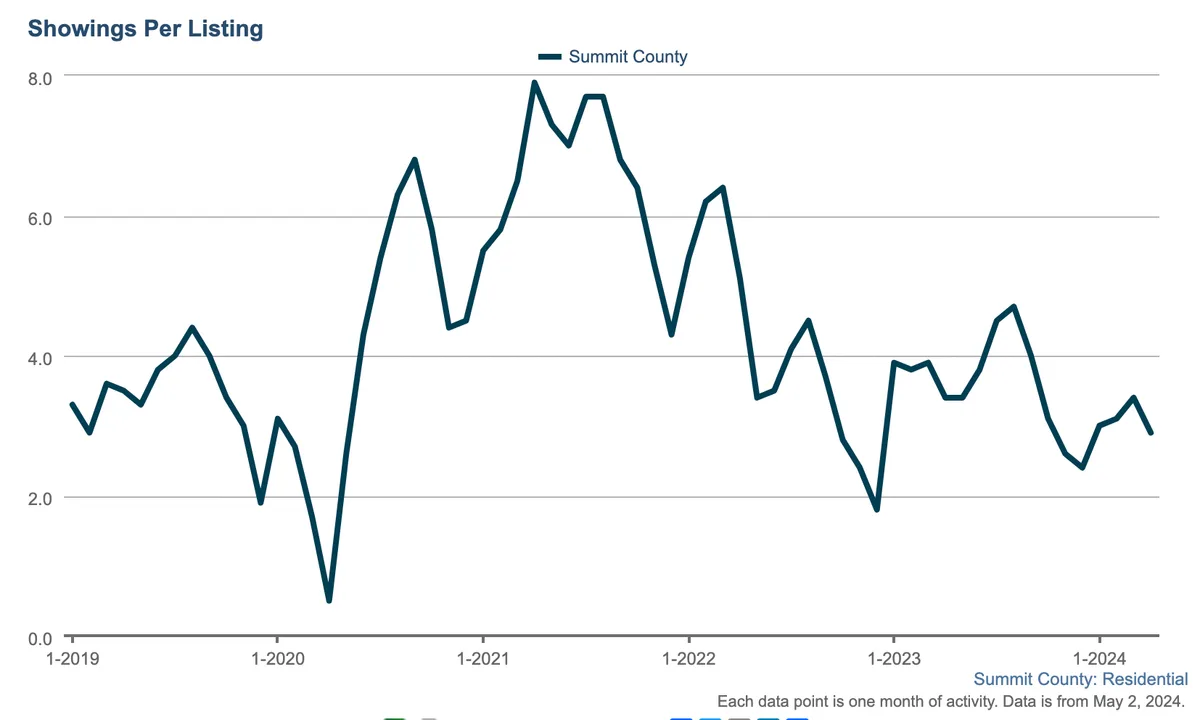
There was less showing activity in April than in March. April saw an average of 2.9 showings per listing ​​​​​​​where March had 3.4.

Line graph showing showings per listing in Summit County from early 2019 to early 2024, with peaks around 2021–2022 and a slight decline through early 2024.

Properties are averaging 10 showings before going under contract.
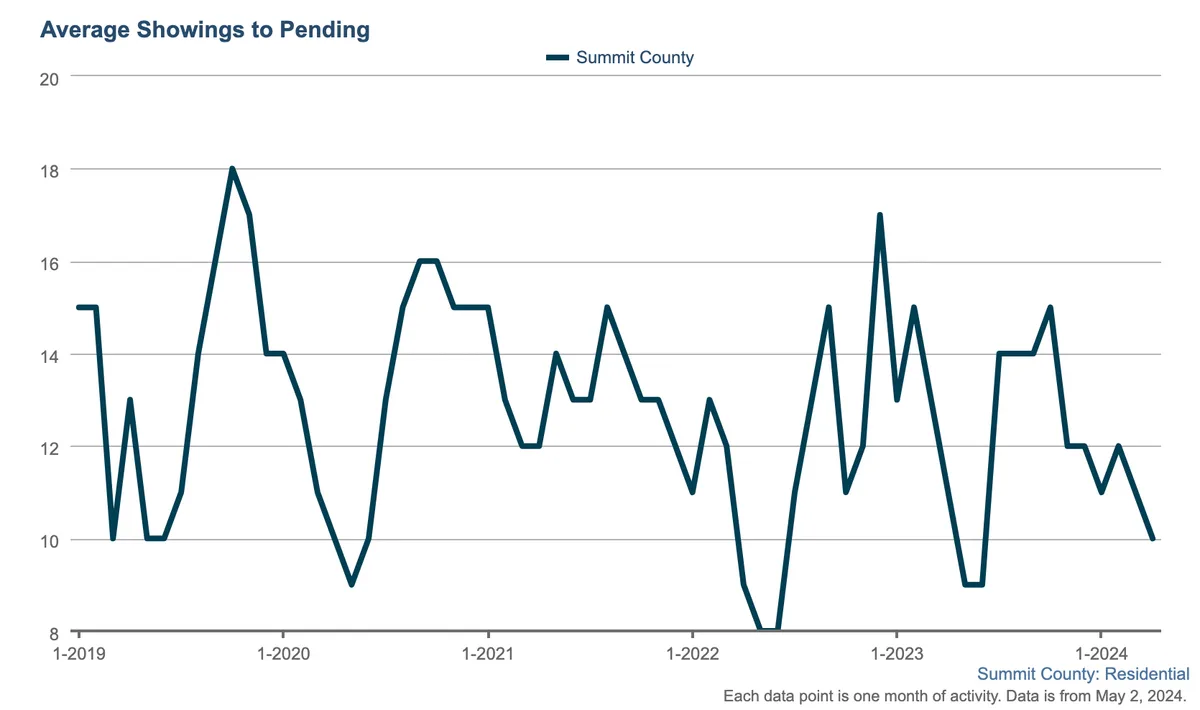
Line chart showing Summit Countys average showings to pending from January 2019 to early 2024, with peaks near early 2020 and mid-2023, and lowest points in late 2020 and early 2021.

Market Updates ·

July 2023 Summit County Market Report

I have been watching one statistic closely because I think it best tells the state of our current market: Number of Sold Residential Properties. This metric…

By Amy Nakos

Market Updates ·

February 2024 Market Update

I am still surprised at the resiliency of the pricing in our market. Resort markets like ours are holding strong because of the desirability of the location…

By Amy Nakos

Market Updates ·

Real Estate Market Update: January 2024

Here is how the market is faring for all Summit County residential real estate. Sold Listings December 2023 saw a total of 94 closings which is the least it…

By Amy Nakos

Thinking about a move in Summit County?

Whether you are buying a second home, selling, or running the numbers on an investment, start with a conversation.